Google Ads reports are packed with metrics, acronyms, and numbers that can be overwhelming if you don't know what to look at first. This guide explains the most important metrics in plain language — what they mean, what good looks like, and how to act on them.
The Four Layers of a Google Ads Report
Google Ads data is organized in a hierarchy: Campaigns → Ad Groups → Ads → Keywords. Each layer shows the same core metrics (impressions, clicks, spend, conversions) but at different levels of granularity.
Start at the campaign level to get the big picture, then drill down to ad groups and keywords to find the specific drivers of performance.
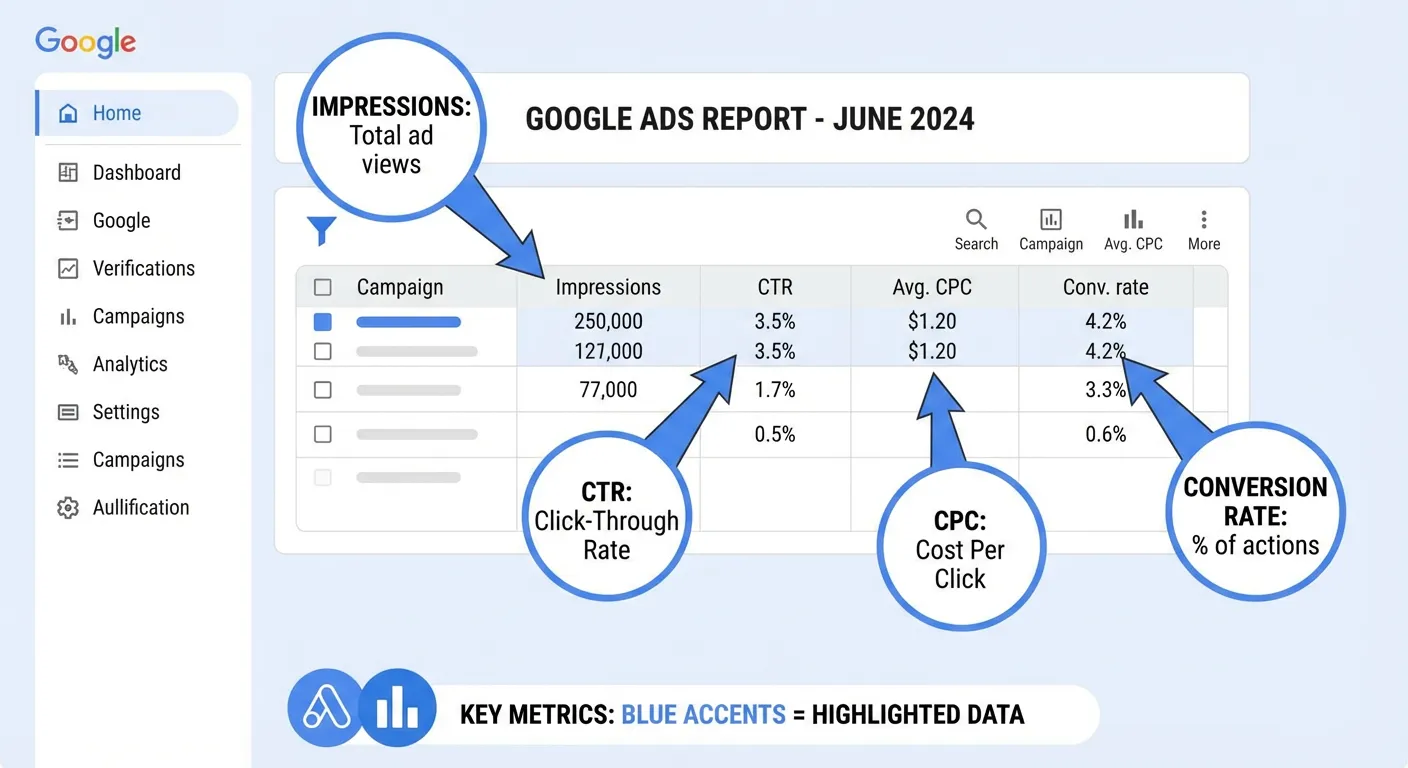
Click-Through Rate (CTR)
Formula: Clicks ÷ Impressions × 100
CTR measures how often people click your ad after seeing it. It's a signal of ad relevance — a higher CTR means your ad copy and keywords are well-aligned with what searchers want.
- Good CTR (Search): 3–10% depending on industry
- Warning: Under 2% suggests ad copy or keyword targeting issues
- Note: Display campaigns have much lower CTRs (0.1–0.5%) — that's normal
CTR directly impacts Quality Score. If CTR is low, Google assumes your ad isn't relevant to the search, which raises your CPC and lowers your ad position.
Cost Per Click (CPC)
Formula: Total Cost ÷ Total Clicks
CPC is what you pay each time someone clicks your ad. It varies significantly by industry — competitive industries like legal, insurance, and SaaS can have CPCs of $10–$50+, while niche B2C products may be under $1.
- High CPC: Usually indicates high competition or low Quality Score
- Low CPC: Can indicate low competition — or low-quality traffic
- Benchmark: Compare against your industry average, not absolute numbers
Improving Quality Score is the most reliable way to reduce CPC without changing bids. A jump from Quality Score 4 to Quality Score 8 can cut your effective CPC in half.
Conversion Rate
Formula: Conversions ÷ Clicks × 100
Conversion rate measures how often clicks turn into meaningful actions — purchases, sign-ups, form fills, calls. It reflects the quality of your landing page and the match between ad intent and what you're offering.
- Average: 2–5% across most industries
- High-performer: 10%+ is achievable with tight keyword/landing page alignment
- Warning: Under 1% despite good CTR suggests a landing page problem
If your CTR is healthy but conversion rate is low, the problem isn't the ad — it's what happens after the click. Review your landing page's relevance, load speed, and call to action.
Cost Per Conversion (CPA)
Formula: Total Cost ÷ Total Conversions
CPA tells you how much you're paying for each conversion. This is the metric that determines whether Google Ads is actually profitable for your business.
- Target CPA: Set based on your customer lifetime value and margin
- Warning:If CPA exceeds your product's profit margin, the campaign loses money at scale
- Optimization: Pause high-CPA keywords; increase bids on low-CPA keywords
Quality Score
Quality Score is Google's 1–10 rating of how relevant your keyword, ad, and landing page are to each other. It's not a metric you directly optimize — it's a diagnostic signal.
Quality Score has three components, each rated as "Above average," "Average," or "Below average":
- Expected CTR — How likely is your ad to be clicked, given its position?
- Ad Relevance— How closely does your ad match the keyword's search intent?
- Landing Page Experience — Is your landing page relevant, fast, and mobile-friendly?
A Quality Score of 7–10 means you're paying below-market CPC. A score of 1–4 means you're paying a premium. Identify your most important keywords with low Quality Score and fix the component rated "Below average."
Return on Ad Spend (ROAS)
Formula: Revenue from Ads ÷ Ad Spend × 100
ROAS is the e-commerce equivalent of CPA. Instead of measuring cost per conversion, it measures revenue generated per dollar spent.
- Break-even ROAS: Depends on your margins — typically 200–400%
- Good ROAS: 400–800% for most e-commerce; 200%+ for high-margin products
- Warning:ROAS below 100% means you're spending more than you're earning
Impression Share
Impression Share shows what percentage of eligible impressions your ads actually received. A 60% impression share means your ads showed for 60% of searches where they were eligible to appear.
- Lost IS (Budget): Impressions lost because your daily budget ran out
- Lost IS (Rank):Impressions lost because your Quality Score or bid wasn't competitive enough
If Lost IS (Budget) is high, increase your budget or tighten targeting. If Lost IS (Rank) is high, focus on improving Quality Score or adjusting bids.
How to Read a Google Ads Report in 5 Minutes
When you open your weekly report, follow this sequence:
- Campaign level: Check total spend, conversions, and CPA. Is the overall account profitable?
- Flag outliers: Which campaigns have the highest spend but lowest conversion rates?
- Keyword level: Sort by spend descending. What are your top 10 keywords by cost? Are they all converting?
- Quality Score: Filter for keywords with score ≤ 4. These are costing you the most per click.
- Search terms: Review new search queries since last week. Add irrelevant ones as negative keywords.
Let AI Read Your Report for You
If you'd rather skip the manual analysis, AdBrief reads your Google Ads report automatically. Upload your CSV exports and get an AI-generated interpretation of all key metrics — with specific recommendations ranked by impact. The entire process takes under 60 seconds.